
It can be used as a tool to help measure different marketing programs and how effective they are working.
- Time-Frame selection - Allows you to select the time frame for the Summary Statistics. By default, the last 7 days of data will be displayed in the Summary Statistics area. You can choose custom dates or select the last 30 days etc. The same time-frame selection is used through the Hotspot Insights panel.
- Select Hotspot(s) - Allows you to select a single Hotspot or multiple Hotspots for the Summary Statistics. By default, ALL hotspot(s) information that you have permission to view will be displayed.
Hotspot Insights Filter
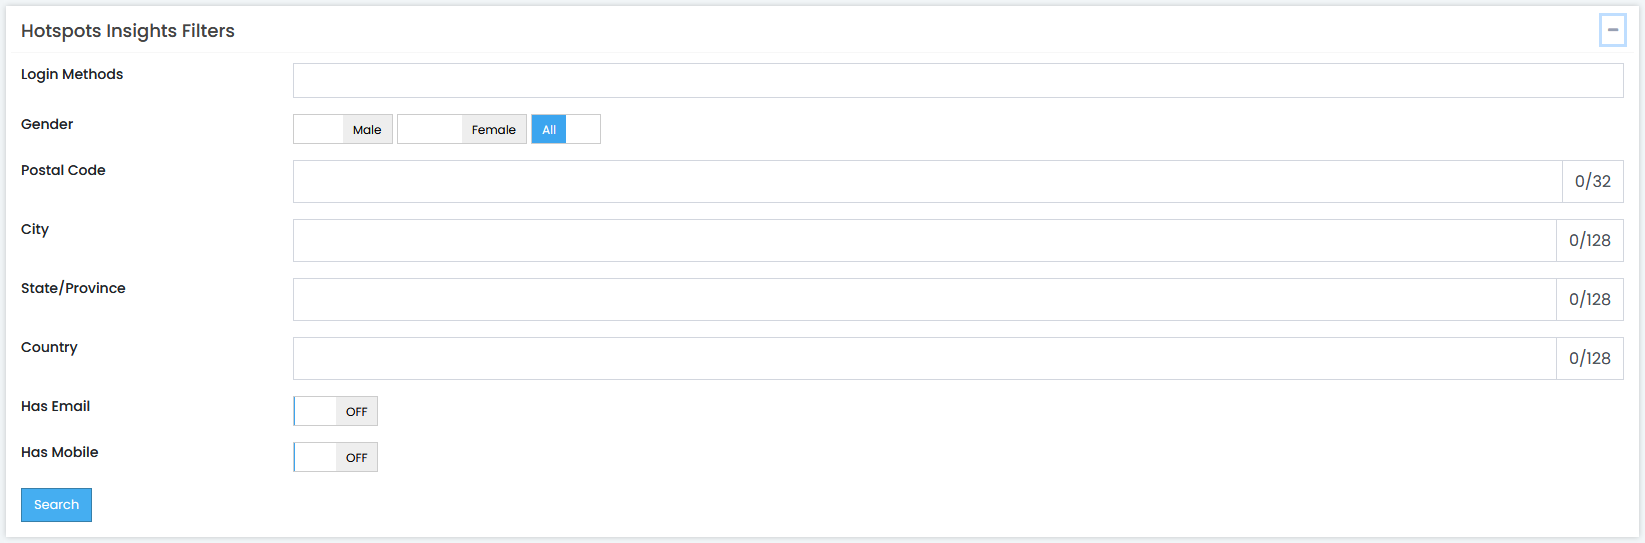
The Hotspot Insights filters allows you to filter the insights data to assess the performance of your hotspots based on the indicators that you're interested in.
- City and State/Province are case sensitive.
- The Login Methods will sort based on the login method chosen during the guests first connection to your hotspots.
- "Has Email" and "Has Mobile" will look at the Guest Profile and display data based on if the profile contains the data, regardless of the connection method used.
Summary Statistics

This shows you at a glance data regarding your Hotspot(s) use compared to the previous same period. In other words, by default, the last 7 days of data vs the previous 7 days is displayed.
- New Guests - This is the total number of new, unique guests that have connected to the selected Hotspot(s) for the first time during the selected time-frame.
- Repeat Guests - This represents the total number of guests who made their first connection before the date range entered.
- Guests - This is the total number of guests (new and repeat guests) that have connected to the selected Hotspot(s) during the selected time-frame.
- Connections - This shows you the number of connections made by the Guests amount.
- Average Connections - The statistical average numbers of connections an made by all guests. (Connections/Guests=Average Connections)
Guest Usage
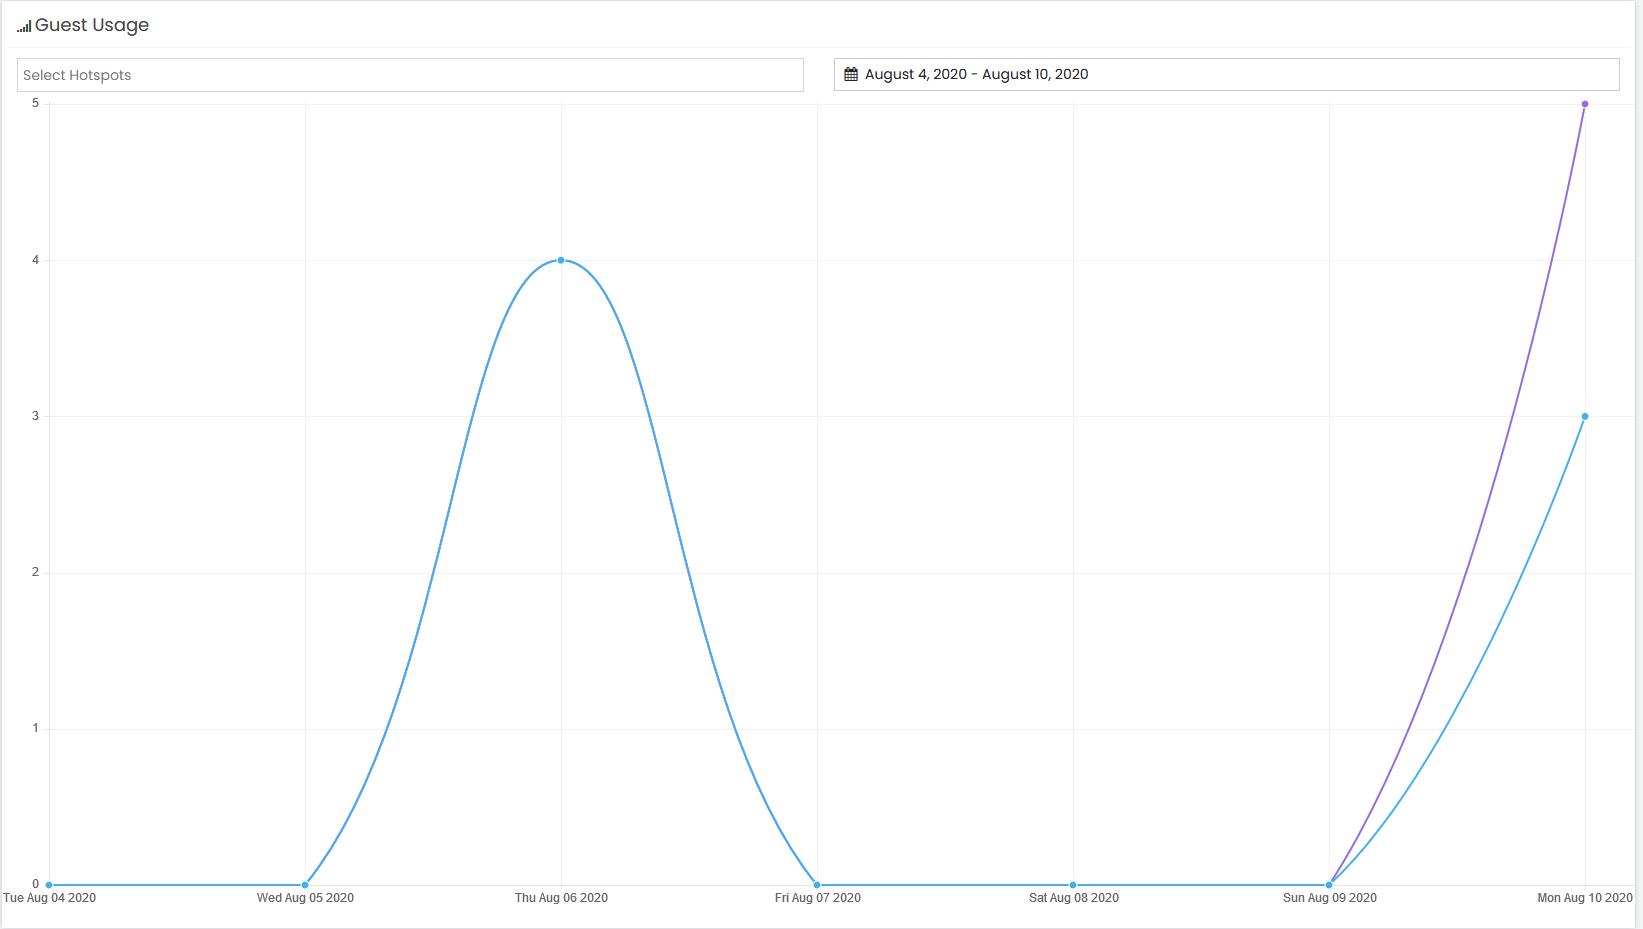
This graph shows you detailed use information on your Hotspot(s) during the selected time-frame. Total Guests - new guests and repeat guest totals. New Guests - guests that had not connected to your Hotspot(s) before the date range specified. This is the best indicator of how many new e-mail addresses your Hotspot(s) are collecting. Repeat Guests - guests that made their first connection to your Hotspot(s) before the starting date of the date range configured.
Device Connections
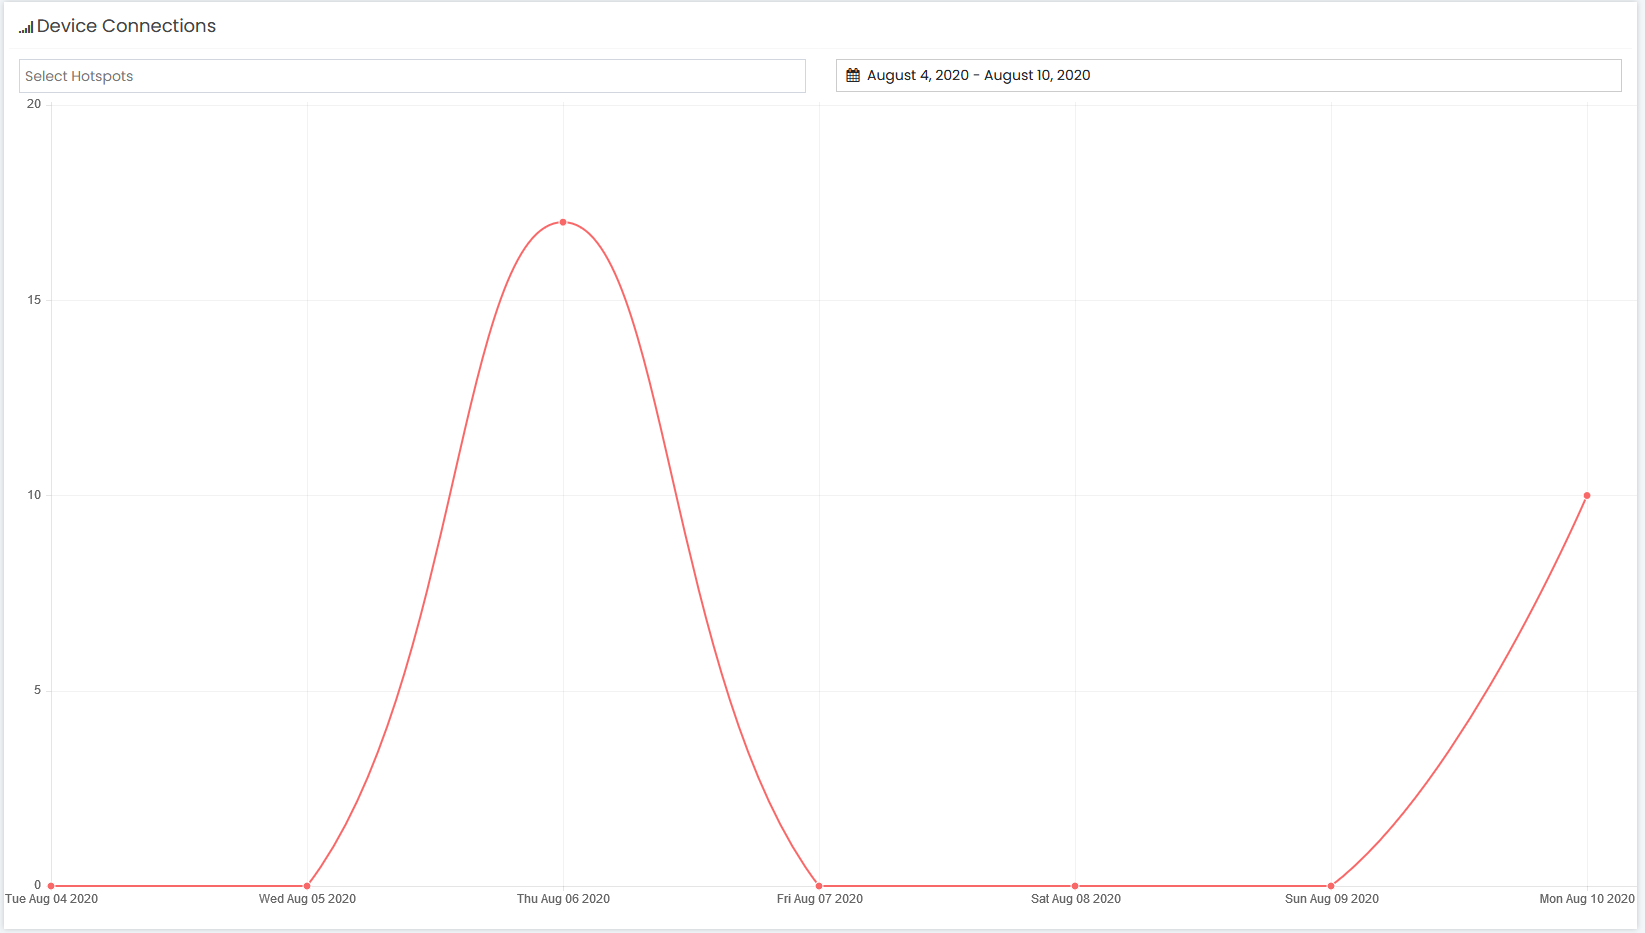
This graph shows you the number of physical connections at your Hotspot(s) during the selected time-frame. Roll your mouse over an area to get the actual number.
Visit Duration
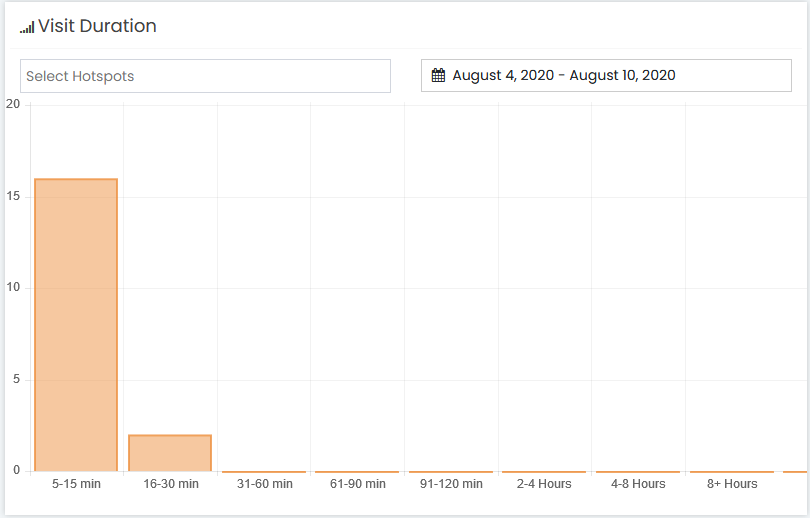
This graph shows aggregate groups of sessions based on the length of their connection reported to the platform by the hardware.
Peak Days
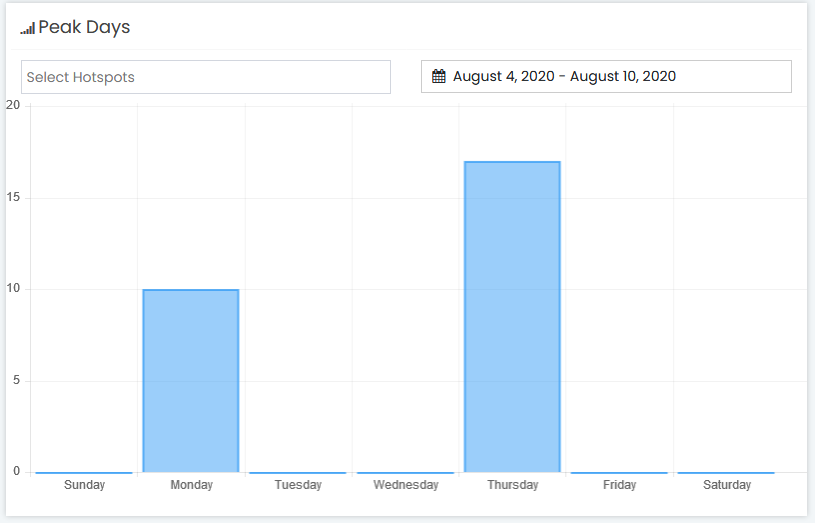
This graph shows you the amount of connections per day of the week that your Hotspot(s) are making. This is a great indicator of what days your venue is busy to help you schedule employees.
Peak Hours
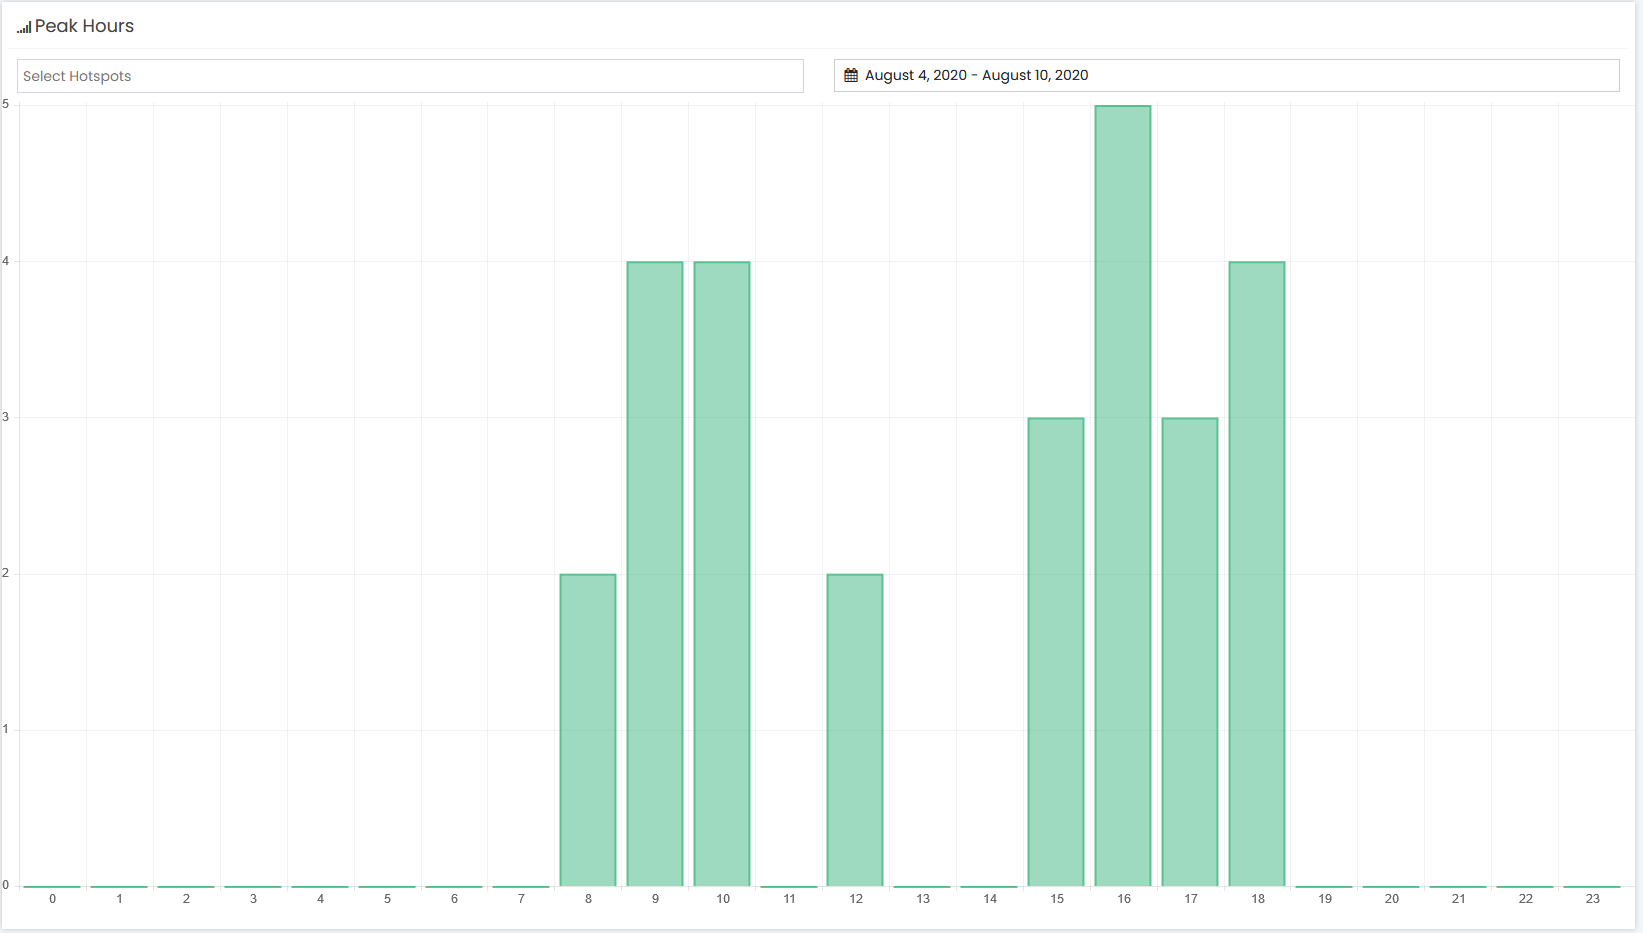
This graph shows you the number of connections per hour (in 24 hour format) that your Hotspot(s) are making. This is a great indicator of when your venue is busy to help you schedule employees.
Devices Used
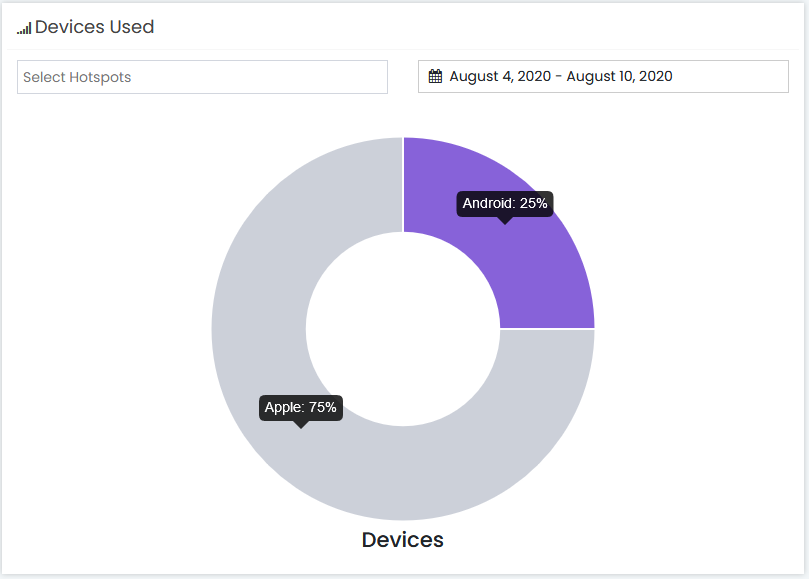
This pie chart shows you (during the chosen time period and hotspot(s)) the type of devices that your guests use to connect to your Hotspot(s).
Connection Method
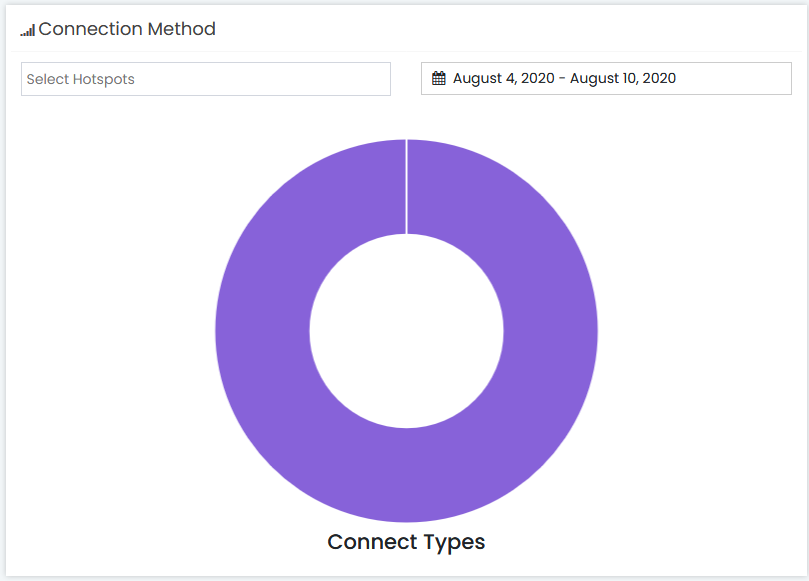
This pie chart shows you (during the chosen time period and hotspot(s)) the method in which your guests connect to your Hotspot(s). Roll your mouse over a specific area to get the percentages.